
Part 1 Ready for summer crop 2022 - State of play
Sep 8, 2022With very little time left until summer crop planting, it is worth spending some of it to understand how much nitrogen and sulfur is available and where it is in the soil profile. Some data to guide dryland growers.
Download this article
When paddocks are trafficable, take a soil sample segmented into the 0-10 cm, 10-30 cm, 30-60 cm and 60-90 cm layers. Simple nitrate nitrogen, ammonium, chloride, and MCP sulfur tests at each depth, like the E37 test from the Nutrient Advantage® Laboratory will provide valuable insights. Nitrogen, as we know, is a dynamic beast! Sampling as close to planting as possible will give a snapshot of the starting position. Consider sampling the prolonged wet areas of paddocks separately from the drier/better drained ones to gain a comparison. These results can be used to adjust the fertiliser program.
LOSSES DURING WET SEASONS
Sampling this year is particularly important as it has been a wet season. This means a high potential for losses, especially from drilled and buried fertiliser applications.
Denitrification
Denitrification losses at this time of year can be significant where there is a carbon source (from soil organic matter and crop residues); anaerobic conditions from waterlogged soils; and the presence of quantities of nitrate-nitrogen present in soil or fertiliser.
Nitrous oxides (N20) and other forms, mainly di-nitrogen (N2) are emitted from soil to the atmosphere when soil is waterlogged, resulting in a denitrification process of soil nitrate N sources (either mineralised from organic matter and residues, and/or fertiliser N nitrified from ammonium to nitrate) driven by soil-borne micro-organisms, soil temperature, water-filled pore space and presence of nitrate. The form and quantity of the significant nitrogen gases can be influenced by the duration of the event, and soil pH (Schwenke, Bell, Conway and Dowling, 2014).
A period of saturation or waterlogging of greater than 24 hours is thought to be conducive to significant losses from this pathway. This does not necessarily mean that soils need inundation or have water lying for oxygen to limited or excluded. Poor drainage, compaction, sodicity and other soil chemical and physical impediments to drainage and water movement can mean a particular part at depth of the profile may be waterlogged or anaerobic while other depths may not be.
Thankfully, denitrification events are episodic, so while losses can be significant, it is rare that all the necessary alignment of multiple conditions occur. Most seasons nitrate-N denitrification losses are around 10%, however, in seasons that are conducive (Table 1), losses can be much larger, greater than 40%.
Table 1: The factors, time of year (soil temperature) and presence or absence of fertiliser nitrate N that influence potential for denitrification losses. Source: Strong et al. 1996.
|
|
Summer |
Winter |
||
|
Factor |
Nil N |
+N fert |
Nil N |
+N fert |
|
Waterlogging |
High |
High |
Low |
Low |
|
Nitrate supply |
Low |
High |
Low/Med |
High |
|
Residues |
High |
High |
Low/Med |
Low/Med |
|
Overall losses |
Low |
Potentially High |
Low |
Low |
Leaching
Leaching (movement beyond the crop root zone) does not occur often on grey and black vertosols of Southern Queensland, where there was found to be less than 1 mm per year of deep drainage below the root zone (Tolmie et al. 2003).
Nutrient (nitrate or sulphate) movement into the soil profile deeper than 20 cm in clay soils needs about 200 mm rainfall (Cox & Strong, 2015).
Both water movement and leaching do not necessarily mean nitrate movement to the same extent or depth.
HISTORY CAN BE INFORMATIVE
The Incitec Pivot Fertilisers long-term experiment site at “Colonsay” on the central Darling Downs (established in 1985) revealed some concerning insights in the last prolonged wet period of 2010-2011. In that season, following wheat harvest, the site received 646 mm of rain between November 2010, and the end of March 2011.
Figure 1 reveals the extent of nitrate-N change from before and after the floods. The site itself was inundated only once but was very wet for much of the four months between samplings. The result was a 68% reduction in available nitrate-nitrogen between the two sample timings. This equated to a reduction of 83 kg N/ha to a depth of 90 cm.
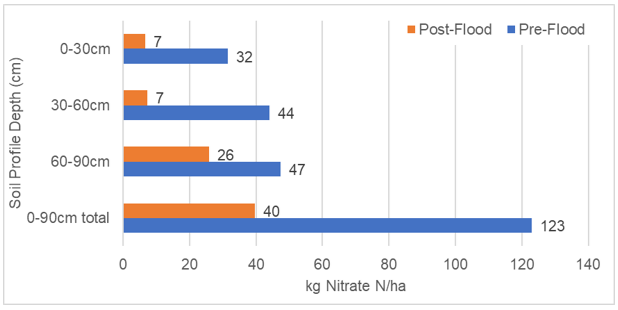
Figure 1: “Colonsay” mineral (nitrate) N change (average of all N treatments) over the wet period December 2010 to March 2011. (Source: Incitec Pivot Fertilisers: unpublished).
The sampled 0-30 and 30-60 cm depths had the largest nitrate-N reduction, 78% (25 kg/ha nitrate-N) and 84% (37 kg/ha nitrate-N) respectively. There was also 45% less nitrate observed in the 60-90 cm layer (21 kg/ha nitrate-N), suggesting either gaseous loss or nitrate movement to a greater depth than that sampled.
This data shows that whilst episodic in nature, when the perfect storm of conditions coincides, and for either a long duration or numerous sporadic durations, nitrogen losses can be large (Figure 2).
This significant denitrification and to a lesser degree, leaching and movement of nitrates can indeed be experienced on our heavier vertosol soils, and are also well documented by Dr Wayne Strong et al in the late 1980s at the Warra experiment, west of Dalby, Queensland.
In 2012 and 2013 there were numerous issues (Dowling, 2013), regarding wheat yield and protein predictability and varietal performance, all linked to N losses during the floods of 2010-11, and the subsequent variability in profile distribution of nitrate-N, and it took some time (2-3 seasons) before the system caught up via management of N, re-applications of N fertiliser, mineralised N and crop removal patterns that finally evened up in profile N distribution again, resulting in more predictable grain yield and protein outcomes.
WHERE ARE WE AT FOR 2022?
Data from the “Colonsay” site from the recent 2021-22 wet period is again concerning. Wheat was harvested on the site in November 2021. Between then until soil sampling on 26 January 2022 the site received 152 mm of rain, then another 523 mm of rain to 26 July 2022. So, a total of 670 mm of rainfall was recorded between harvest 2021 and 26 July 2022. The site was waterlogged.
In addition, soil temperatures remained greater than 15°C until late May 2022. Schwenke et al. (2014) suggest denitrification occurs at all temperatures but increases exponentially above 15°C, with peaks between 23-27°C.
Figure 2 illustrates the change in the 0-90cm profile the quantity of soil mineral (nitrate) N between late January 2022 and late July 2022.
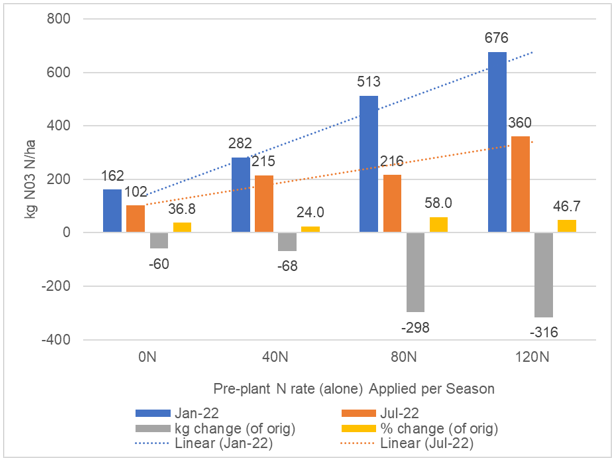
Figure 2: Soil total profile mineral N change (kg/ha and % change (i.e. lost) between January and July 2022 in the 0-90 cm soil profile at the Incitec Pivot Fertilisers “Colonsay” long-term experimental site on the central Darling Downs. (Note: the long-term repeated pre-plant N rate applications on bottom axis).
In January 2022, the distribution of the nitrogen in the profile (Figure 3) reflected the previous seasonally repeated fertiliser applications, extraction and removal by crops, and highlighted the mineralisation and movement of N following the drought. The distribution was plausible and made sense. More nitrogen was found in the deeper parts of the profile (>30 cm) and with higher N rates.
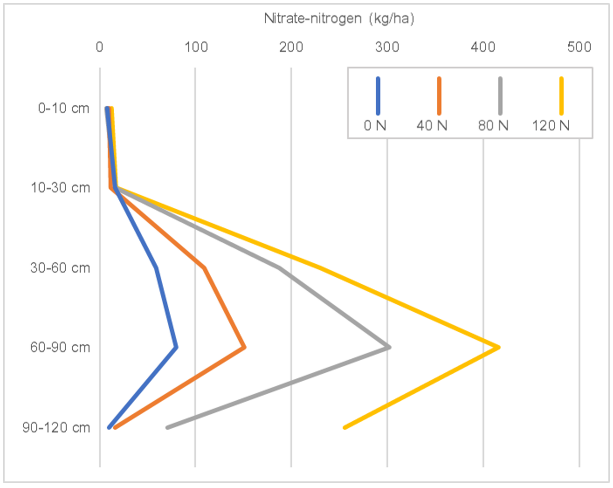
Figure 3: Soil mineral N profile distribution in January 2022 (N rates repeatedly applied pre-plant denoted by coloured lines) in the soil profile segments sampled at the Incitec Pivot Fertilisers “Colonsay” long-term experimental site on the central Darling Downs.
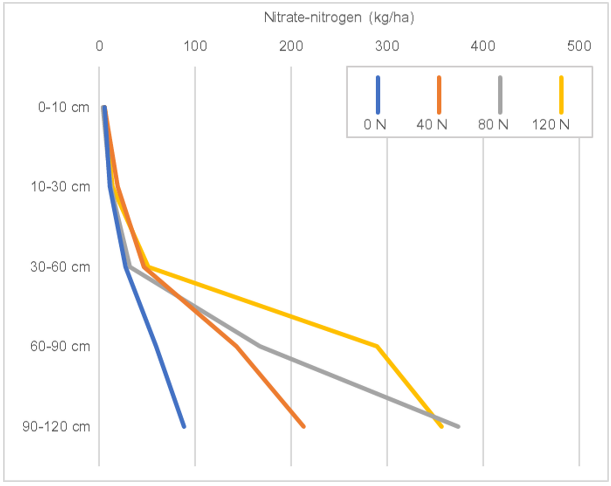
Figure 4: Soil mineral N profile distribution in July 2022 (N rates repeatedly applied pre-plant denoted by coloured lines) in the soil profile segments sampled at the Incitec Pivot Fertilisers “Colonsay” long-term experimental site on the central Darling Downs.
By July 2022 (Figure 4) there was a different distribution in the soil profile. This suggests nitrate-N losses at all depths, but mostly from the 30-60 cm layer, which is where much of the residual N was prior to the wet fallow season.
Table 2: Nitrate-N (kg) results in July 2022 and the difference (quantity and percentage) compared to the results in January 2022.
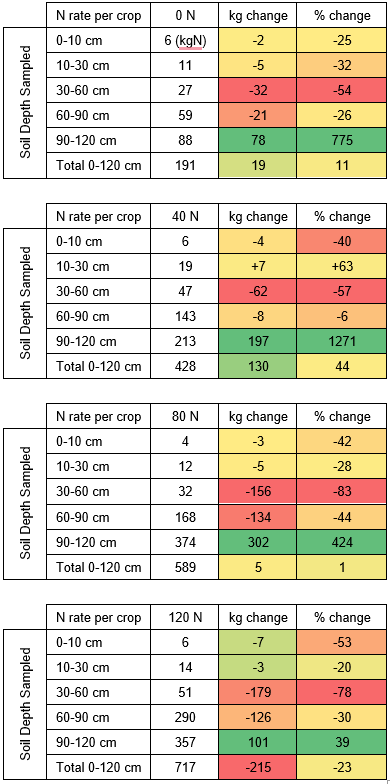
Comparing the January and July samples (Table 2) shows:
- a reduction in the total quantity of the profile nitrate-N;
- a redistribution of N deeper in the profile;
- an accumulation of N in 30-60 cm segment, indicating that this is the depth of the greatest N loss or movement.
- at higher N rates (80 N and 120 N) the loss from the 60-90 cm segment was greater.
- nitrate-N increased in the 90-120 cm segment, notably also at the control (nil) 0 N rate, indicating downward movement of N.
DON'T FORGET THE SULFUR
Sulfur (S) is released in soil and used by crops in the same way as N. However, crop demand for S is one tenth that of N. Sulfur is mineralised from organic matter and grain removal is fairly low, so responses to applied S in most years in most systems are unlikely.
Yield responses are most likely if there is a history of Sulfur responses, in grazing or fodder crops that tend to have a higher S requirement, or evidence of S deficiency in plant tissue or grain N:S ratios are low.
But a response is likely after:
- wet seasons (S movement down profile)
- waterlogging events (restricting mineralisation of S)
- high frequency cropping rotations where cereal N responses are frequent
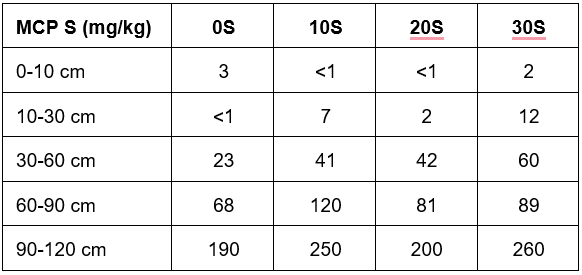
Sulfur soil sampling should occur in surface, sub-soil and deep soil layers to 60 cm, to fully assess the sufficiency. Recent soil test results (Table 3) show lower values in the surface, and more S in the 30-60 cm layer. Surface-only soil sampling for sulfur would not reveal this type of distribution and accumulation at depth.
Table 3: Soil MCP S results and profile distribution in July 2022 at the Incitec Pivot Fertilisers “Colonsay” long-term experimental site on the central Darling Downs. Plots receive S applications pre-plant (as GranAm blended with urea) at rates of 10 S; 20 S & 30 S per season.
WHERE TO FROM HERE?
Limiting future losses this season where soil moisture, nitrate and soil temperature align is difficult. But being armed with knowledge of the soil status and starting position is best. Part 2 of this Agronomy Insight will outline actionable steps for the season.
REFERENCES
Cox, H and Strong, W (eds) (2015). ‘The Nitrogen Book. Principles of soil nitrogen fertility management in southern Queensland and northern New South Wales farming systems’. The Queensland Government.
Dowling, C. (2013). ‘Low protein: is it timing, decision making or something else? What is low protein in cereals telling us?’. GRDC Update Papers, GRDC, Canberra. https://grdc.com.au/resources-and-publications/grdc-update-papers/tab-content/grdc-update-papers/2013/03/low-protein-is-it-timing-decision-making-or-something-else.
Schwenke G, Bell M, Conway M, & Dowling C, (2014). ‘Denitrification Fact Sheet (Northern Region): Reducing potential N losses’. GRDC, Canberra. https://grdc.com.au/~/media/documents/resources/publications/fact-sheets/denitrificationfsdec14hires.pdf.
Strong WM, Dalal RC, Weston EJ, Cooper JE, Lehane KJ, and King AJ (1996). ‘Nitrogen fertiliser residues for wheat cropping in sub-tropical Australia’. Australian Journal of Agricultural Research 47, 695-703.
Tolmie PE, Silburn DM, Biggs AJW (2003). ‘Estimating deep drainage in the Queensland Murray-Darling Basin using soil chloride.’ Department of Natural Resources and Mines, Coorparoo, Queensland. QNRM03020.
FURTHER INFORMATION
For more information or advice about summer crop nitrogen losses or the Colonsay long term trial site feel free to contact me on 0417 896 377 or at bede.omara@incitecpivot.com.au.
You can also contact David McRae: david.mcrae@incitecpivot.com.au .
DISCLAIMER
This is a guide only, which we hope you find useful as a general tool. While Incitec Pivot Fertilisers has taken all reasonable care in the preparation of this guide, it should not be relied on as a substitute for tailored professional advice and Incitec Pivot Fertilisers accepts no liability in connection with this guide.
Incitec Pivot Fertilisers manufactures and sources fertilisers from other suppliers. The fertiliser supply chain extends beyond the company’s direct control, both overseas and within Australia. Incitec Pivot Fertilisers hereby expressly disclaims liability to any person, property or thing in respect of any of the consequences of anything done or omitted to be done by any person in reliance, whether wholly or in part, upon the whole or any part of the contents of this article.