
The nitty gritty of soil sampling
Feb 2, 2018We all know the importance of soil testing and the valuable data it can provide for fertiliser and soil amendment recommendations.
Download this article
We all know the importance of soil testing and the valuable data it can provide for fertiliser and soil amendment recommendations.
With the soil testing season ahead of us, it is timely to reflect on what makes a good representative sample.
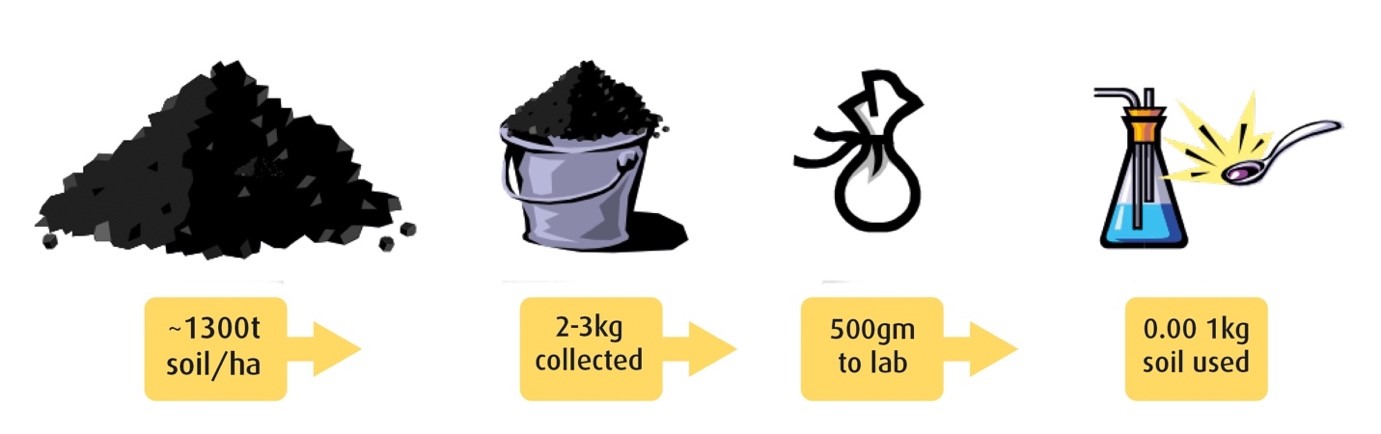
It sounds easy – take the right number of samples, from the right areas, at the right depths – but the diagram below illustrates just how challenging the task can be.
Assuming a bulk density of 1.3g/cm3 and sampling to 10 cm, for each hectare of land there is about 1300 tonnes of soil.
From this, we may take 30 cores that can weigh several kilograms, of which we send 500 grams to the laboratory. Only a small proportion of this 500 grams is used for each test.
Figure 1: Obtaining a representative sample
These are the essentials to obtaining a clean and representative sample.
- Avoid non-typical areas (rocky outcrops, salt areas, variations in pasture species, weedy areas).
- Avoid stock toughs, fence lines, close to trees, headlands.
- Avoid gypsum and lime dump sites.
- Ensure the sample equipment is set to the correct depth (0-10 cm no deeper or shallower).
- Ensure the equipment is clean.
Here are some lesser known sampling techniques.
-
Keep to one soil type (do not mix soil types as averages mean nothing).
-
If the farm has been set up in zones, sample to those zones.
-
If there are soil maps for the district, consult them.
-
Ensure paddock sampling occurs at the same time of year to minimise temporal variation.
-
Do not remove organic matter from the soil surface – it’s part of the soil you are sampling.
-
Use other data, including EM maps or multiple year yield maps to narrow down paddock variation.
- Log sample sites using a GPS for repeatability or trouble shooting.
- Take 30-40 soil cores for each sample (0-10cm).
Accounting for residual phosphorus
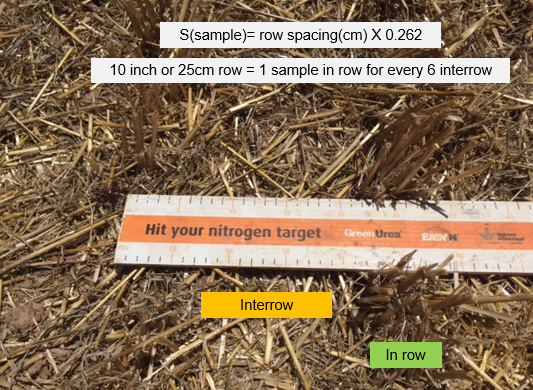
One of the main areas of variability when testing for phosphorus in cropping systems is likely to be in the previous fertiliser band.
The equation to determine the number of cores to be taken in the previous season’s sowing row and inter row is: S (sample) = row spacing (cm) x 0.262
For example, on 100 cm row spacings, one core should be taken in the sowing row for every 26 cores in the inter row, or on 25 cm row spacings, one core is taken in the sowing row for six in the inter row.
Following the harvest of 2017, three sampling methods were used to evaluate the potential for variation in nutrient concentration results, particularly with the immobile nutrient phosphorus. Soil sample areas were kept to relatively small zones (approx. 0.1 ha). The three sampling techniques compared were:
- All cores taken in the sowing row
- All cores taken in the inter row
- Using the formula S = row spacing (cm) x 0.262.
The results are shown in the table below. While there is some variation and no clear trends in Colwell P values, half of the samples did have a higher Colwell P value when all the cores where taken in the row.
Accounting for some, but not all of the residual phosphorus (and other immobile nutrients) by using correct sampling procedures is very important. As always with sampling, consistency is the key.
Comparing phosphorous test results by sampling technique, Victoria, 2017
|
|
Sample method |
Phosphorus (Colwell P) mg/kg |
|
Site 1 |
25 cm 1:6 |
32 |
|
Inter row |
37 |
|
|
In row |
33 |
|
|
Site 2 |
25 cm 1:6 |
49 |
|
Inter row |
49 |
|
|
In row |
55 |
|
|
Site 3 (Mallee) |
33.3 cm 1:9 |
17 |
|
Inter row |
20 |
|
|
In row |
19 |
|
|
Site 4 (Mallee) |
33.3 cm 1:9 |
21 |
|
Inter row |
17 |
|
|
In row |
17 |
|
|
Site 5 (Mallee) |
33.3 cm 1:9 |
16 |
|
Inter row |
16 |
|
|
In row |
18 |
|
|
Site 6 (Mallee) |
33.3 cm 1:9 |
16 |
|
Inter row |
25 |
|
|
In row |
31 |
|
|
Site 7 (Mallee) |
33.3 cm 1:9 |
28 |
|
Inter row |
30 |
|
|
In row |
33 |
|
|
Site 8 (Mallee) |
33.3 cm 1:9 |
52 |
|
Inter row |
41 |
|
|
In row |
42 |
Deep soil testing
Deep soil testing is important for determining any subsoil constraints (salt, sodium and boron) and the depth of those constraints and for establishing mineral nitrogen and sulphur levels for better N and S budgeting.
While the rules around gaining a representative sample are generally the same as for a 0-10 cm sample, there are some subtle differences.
Firstly, restrict the sampling area to a smaller area, maybe several hectares in size. The area can be selected by using historic yield maps, EM surveys or previous shallow soil tests to ensure a very uniform parcel of ground that also represents a larger percentage of the whole property.
In this area, take at least six deep cores to the rooting depth of the crop. This might vary from 30 cm to more than 1.2 m. To determine the rooting depth, you can look for the previous crop’s roots or use information on known soil constraints from previous tests.
Segmenting samples into 0-10 cm, 10-30 cm, 30-50 cm and 50-70 cm increments can assist in determining if there are any subsoil constraints and where they reside.
If the testing is purely for nitrogen budgeting, I see no great benefit in segmenting the samples. A single sample, comprising at least six cores, to rooting depth is sufficient.
We generally see most of the residual nitrogen in the top 30 cm of soil, unless very high rates of nitrogen have been applied or leaching has occurred on lighter soil types, which can result in some percolation of nitrogen down the profile.
Following the 2017 harvest, deep soil samples were taken at eight sites to compare the nitrogen test results between segmented and whole sampling techniques.
In the Mallee, samples were segmented at 0-10 cm, 10-30 cm, 30-50 cm and 50-70 cm and compared with whole 0-70 cm samples. In the Riverine Plains, samples were segmented at 0-10 cm, 10-30 cm, 30-60 cm and 60-80 cm and compared with whole 0-80 cm samples.
The following table shows that in most cases, there was very little variation.
Comparing deep N results by sampling technique, Victoria, 2017
|
|
Sample method |
Total available nitrogen (kg/ha) |
|
Site 1 |
Segmented |
41 |
|
Whole |
28 |
|
|
Site 2 |
Segmented |
28 |
|
Whole |
33 |
|
|
Site 3 (Mallee) |
Segmented |
8 |
|
Whole |
10 |
|
|
Site 4 (Mallee) |
Segmented |
8 |
|
Whole |
7 |
|
|
Site 5 (Mallee) |
Segmented |
8 |
|
Whole |
8 |
|
|
Site 6 (Mallee) |
Segmented |
8 |
|
Whole |
12 |
|
|
Site 7 (Mallee) |
Segmented |
8 |
|
Whole |
16 |
|
|
Site 8 (Mallee) |
Segmented |
17 |
|
Whole |
17 |
Segmenting deep soil samples provides great insights into potential subsoil constraints, which can lead to restrictions in rooting depth and ultimately affect decisions on crop selection.
However, for purely nitrogen and sulphur sampling, a whole core replicated at least six times to rooting depth is adequate.
In summary, soil testing is a critically important step in making good fertiliser and soil amendment decisions, as well as guiding crop choice.
Errors in sampling are the largest cause of incorrect interpretation and subsequent recommendations.
Use a planned sampling approach considering why samples are being taken (monitoring, trouble shooting or budgeting), where representative samples are to be taken (using as much data and history as possible), when samples are to taken (time of year/soil conditions) and how many cores for each sample and samples for each paddock (or different zone).
Please get in touch if you have any queries or would like to discuss any aspect of your sampling program.
Lee Menhenett
0412 565 176
Lee.menhenett@incitecpivot.com.au